

Solana Price Prediction: SOL primed for a breakout as it completes a rounding bottom pattern
- Solana price has completed a rounding bottom pattern, hinting at a shift from a bearish to bullish trend.
- SOL could record a new all-time high if it breaks above the technical formation; $ 224.14 is the level to watch.
- A candlestick close below $80.00 would invalidate the bullish thesis.
Solana (SOL) price has conformed to the broader market crash, following in the steps of Bitcoin (BTC) price that remains in the red below the $65,000 threshold. For SOL, however, the sensational altcoin could have a big move in store as it flirts with a bullish reversal pattern.
Also Read: Solana price primed for recovery if bulls hold $130
Solana price flirts with a rounding bottom pattern
Solana price suffered a prolonged fall beginning November 2021 through January 2023, falling by over 98%. This was followed by a brief horizontal consolidation before the bulls took over, with the price action culminating in a rounding bottom pattern.
A rounding bottom pattern is a bullish reversal pattern that happens after a prolonged downtrend. The price action forms a “U” shape, indicating a change in long-term price movement or sentiment from bearish to bullish, where the price decline loses momentum, followed by a gradual recovery before a breakout to the upside.
If the $130.45 support holds, Solana price could bounce north into the supply zone that stretches from $197.70 to $250.21. A break and close above its midline on the weekly timeframe at $224.14 would confirm the continuation of the primary trend.
In a highly bullish case, Solana price could flip the supply zone into a support or bullish breaker, confirmed by reclamation of the all-time high at $259.90, before establishing a higher high.
The position of the Relative Strength Index (RSI) above 50 suggests an abounding bullish outlook for the Solana price, tilting the odds further in favor of the upside. The likely play is a bounce off this momentum indicator above the 50 mean level, kickstarting a new uptrend for SOL.
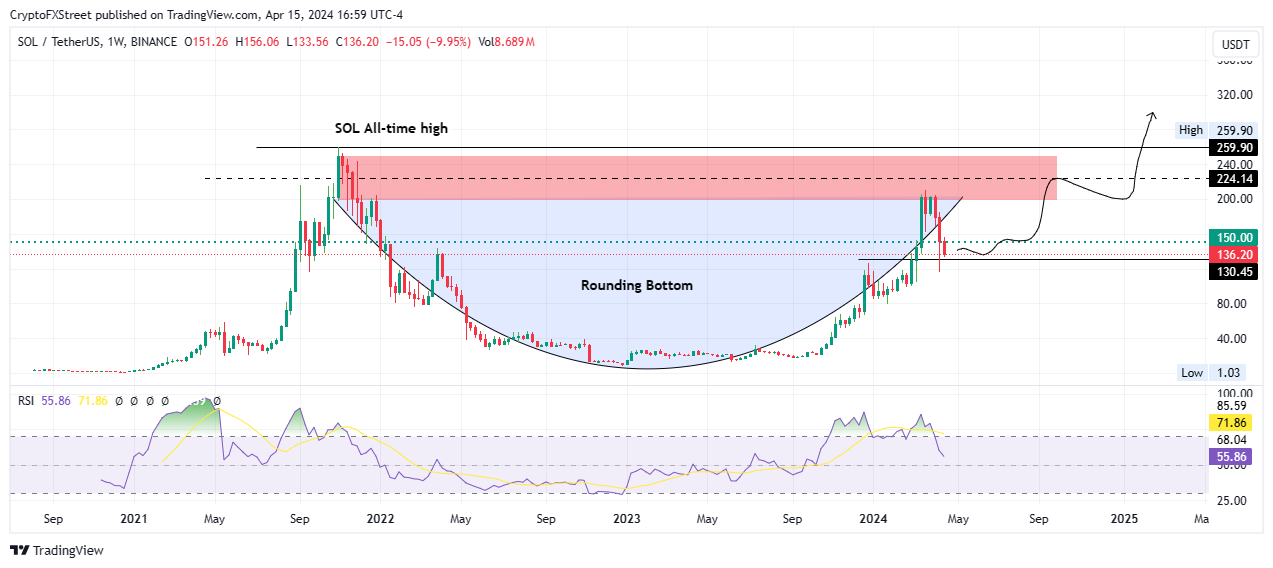
SOL/USDT 1-week chart
Reinforcing the bullish thesis is the volume metric on Santiment, which is steadily rising to show increased interest and activity in SOL. It also points to greater liquidity, more market participation, and potentially stronger price movements.
%20[23.58.03,%2015%20Apr,%202024]-638488157951817081.png)
SOL price, volume
There has also been a significant rise or spike in the number of Solana discussions over the last week, with optimism about the token jumping strongly amid the growth of quotations.
%20[00.42.42,%2016%20Apr,%202024]-638488158672842684.png)
SOL Social volume, Social dominance
In a post on April 9, Santiment analysts observed a rise in discussions regarding Bitcoin, Ethereum, and Solana, with BTC facing an upcoming halving event in around four days, bringing the prices of Ethereum and Solana into the spotlight.
️ #Bitcoin (#1 market cap), #Ethereum (#2), and #Solana (#5) are constantly receiving a heavy amount of attention, and for good reason. But this week has seen an even higher uptick in discussions amongst assets that already receive the lion's share of attention in #crypto… pic.twitter.com/WNxc93SCQ5
— Santiment (@santimentfeed) April 8, 2024
On the other hand, if the bears have their way, Solana price could lose the support at $130.45, extending the fall to the $80.00 level. A candlestick close below this level would invalidate the bullish thesis.
Các bài viết liên quan


